Working with Big Data
“Happy families are all alike; every unhappy family is unhappy in its own way.”
Leo Tolstoy’s Anna Karenina
(by way of Wickham, 2014)
Best practices
- Good enough practices.
- What did you take from Wilson et al.?
- What do you think you’ll start using this week?
- What do you hope to start using in the future?
Best practices in naming things (files in particular)
Based on Jenny Bryan’s work
- Machine readable
- Human readable
- Plays well with default ordering
Machine readable
Based on Jenny Bryan’s work
- Usable with regular expressions and globbing
- No spaces
- No punctuation
- No accented characters (or other funky stuff)
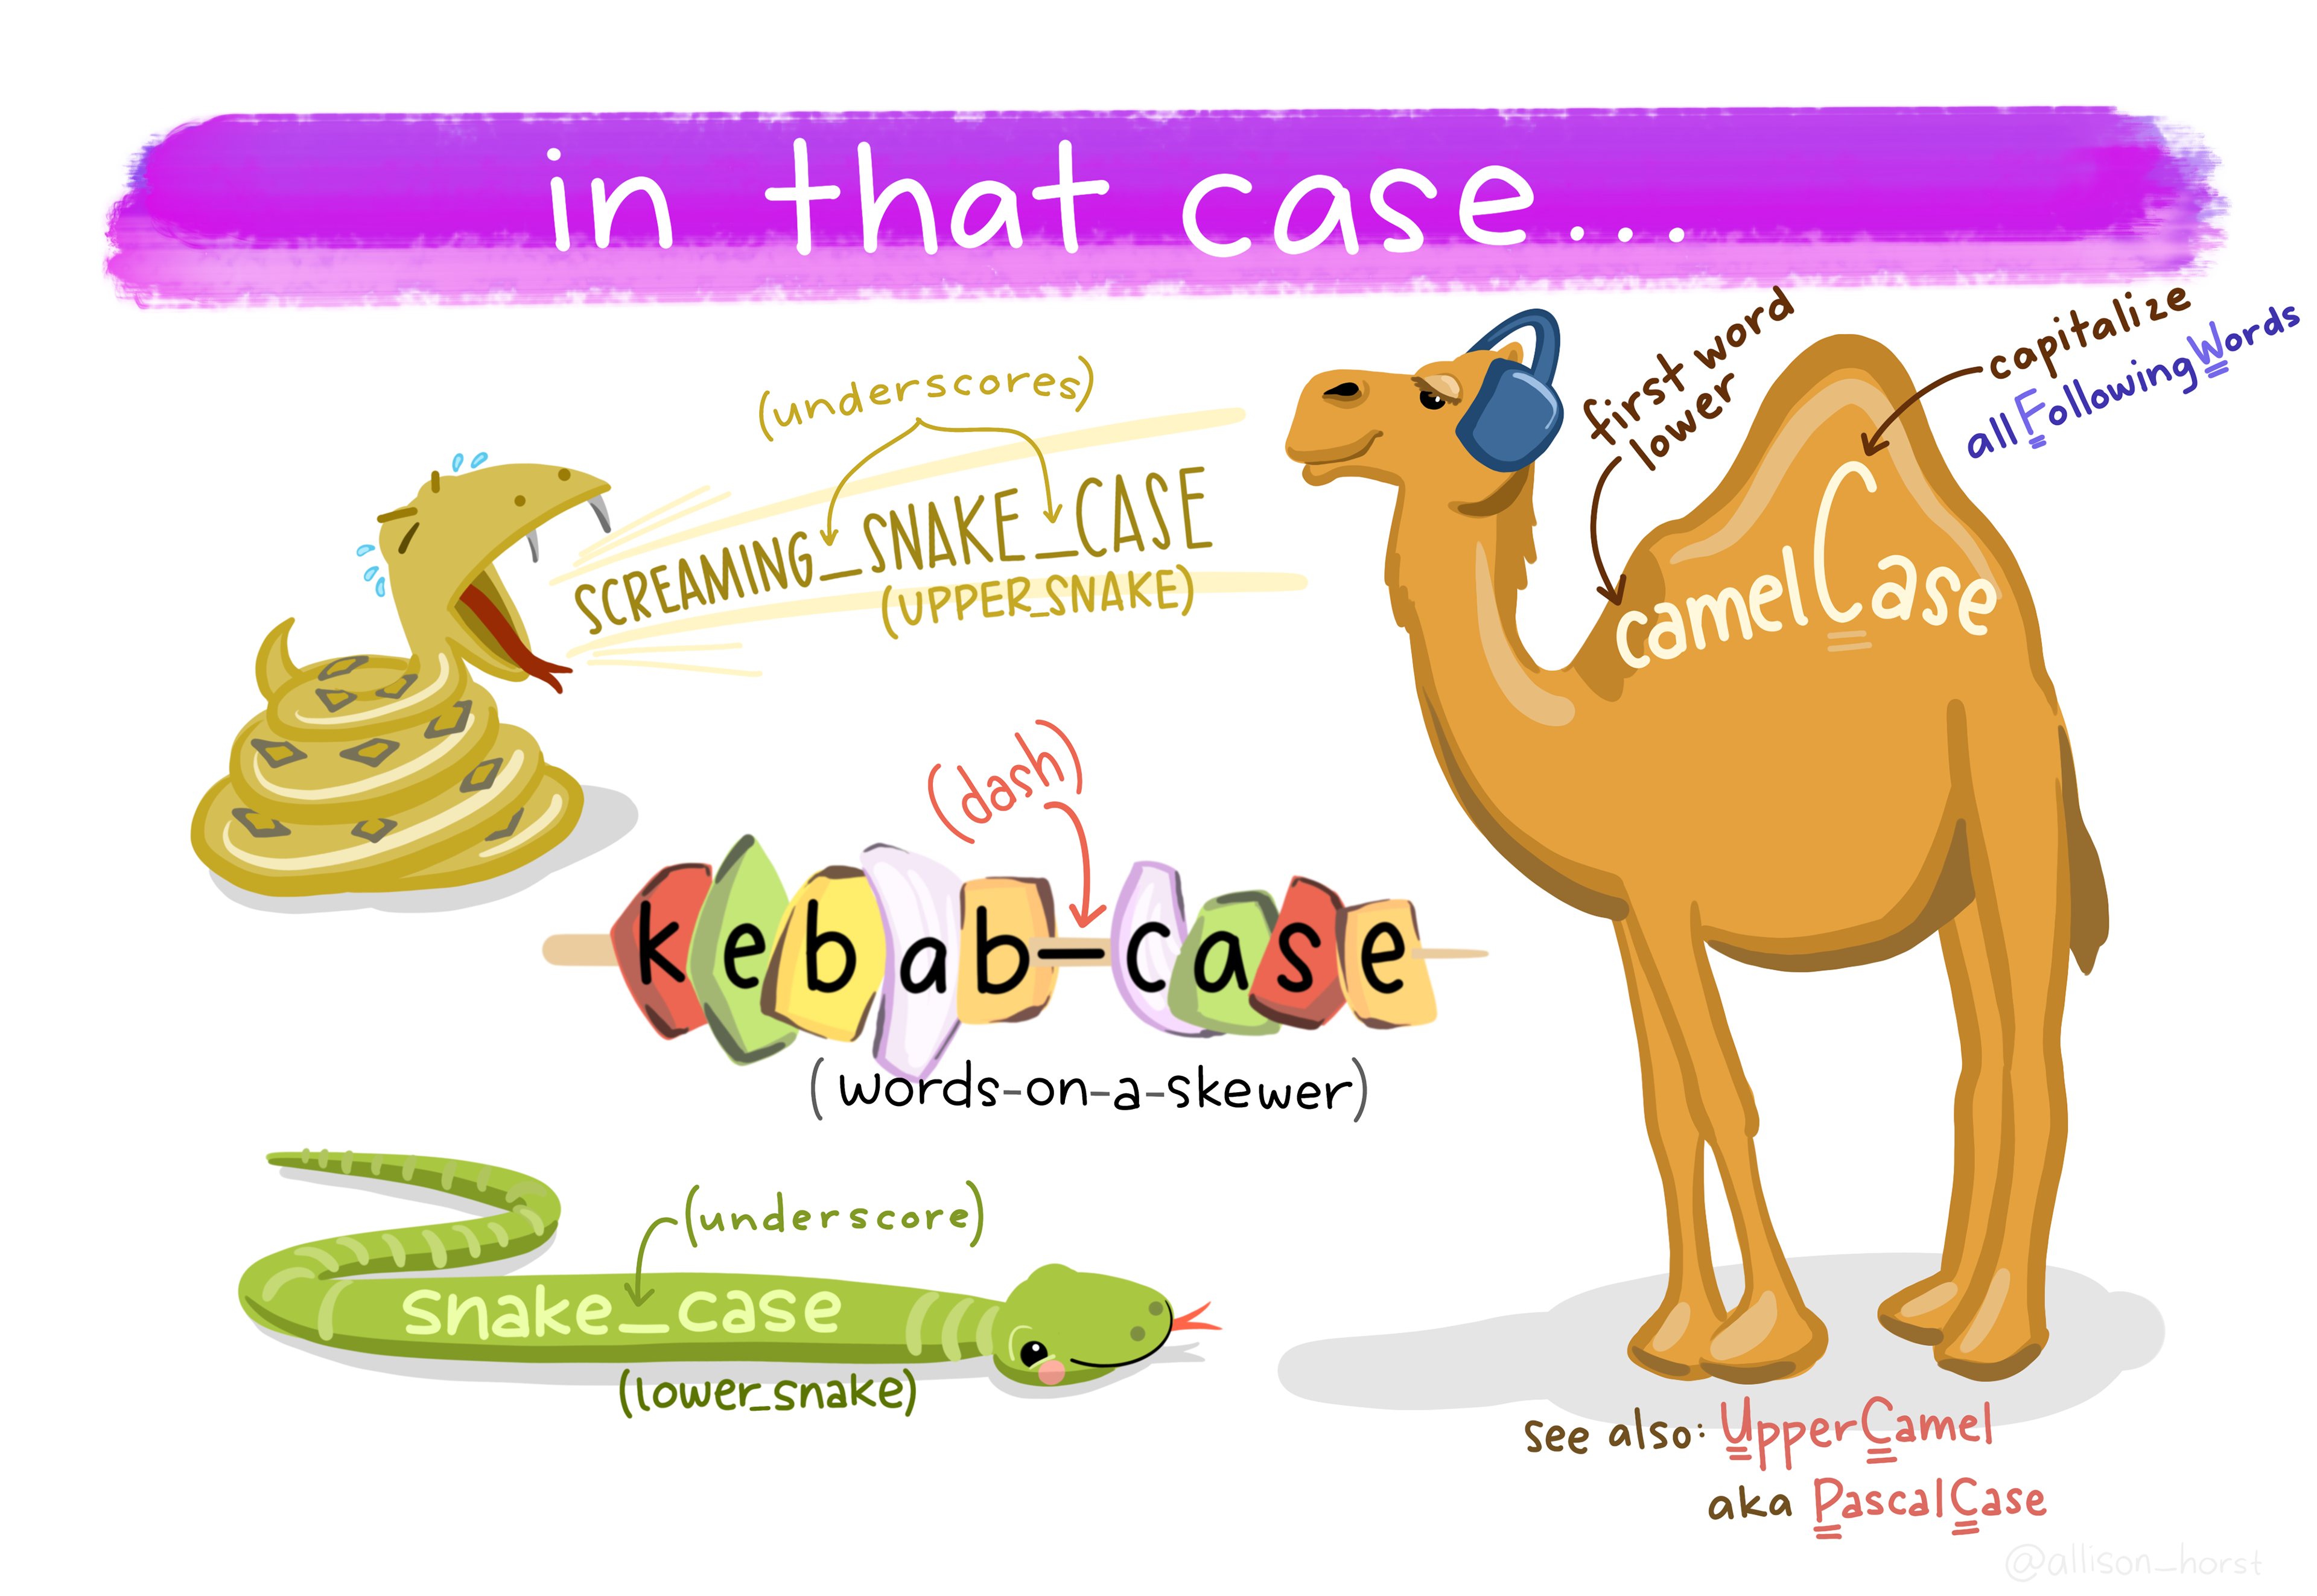
- Case matters
- Easy to use in code
- Use the delimiters deliberately
Some things you could do

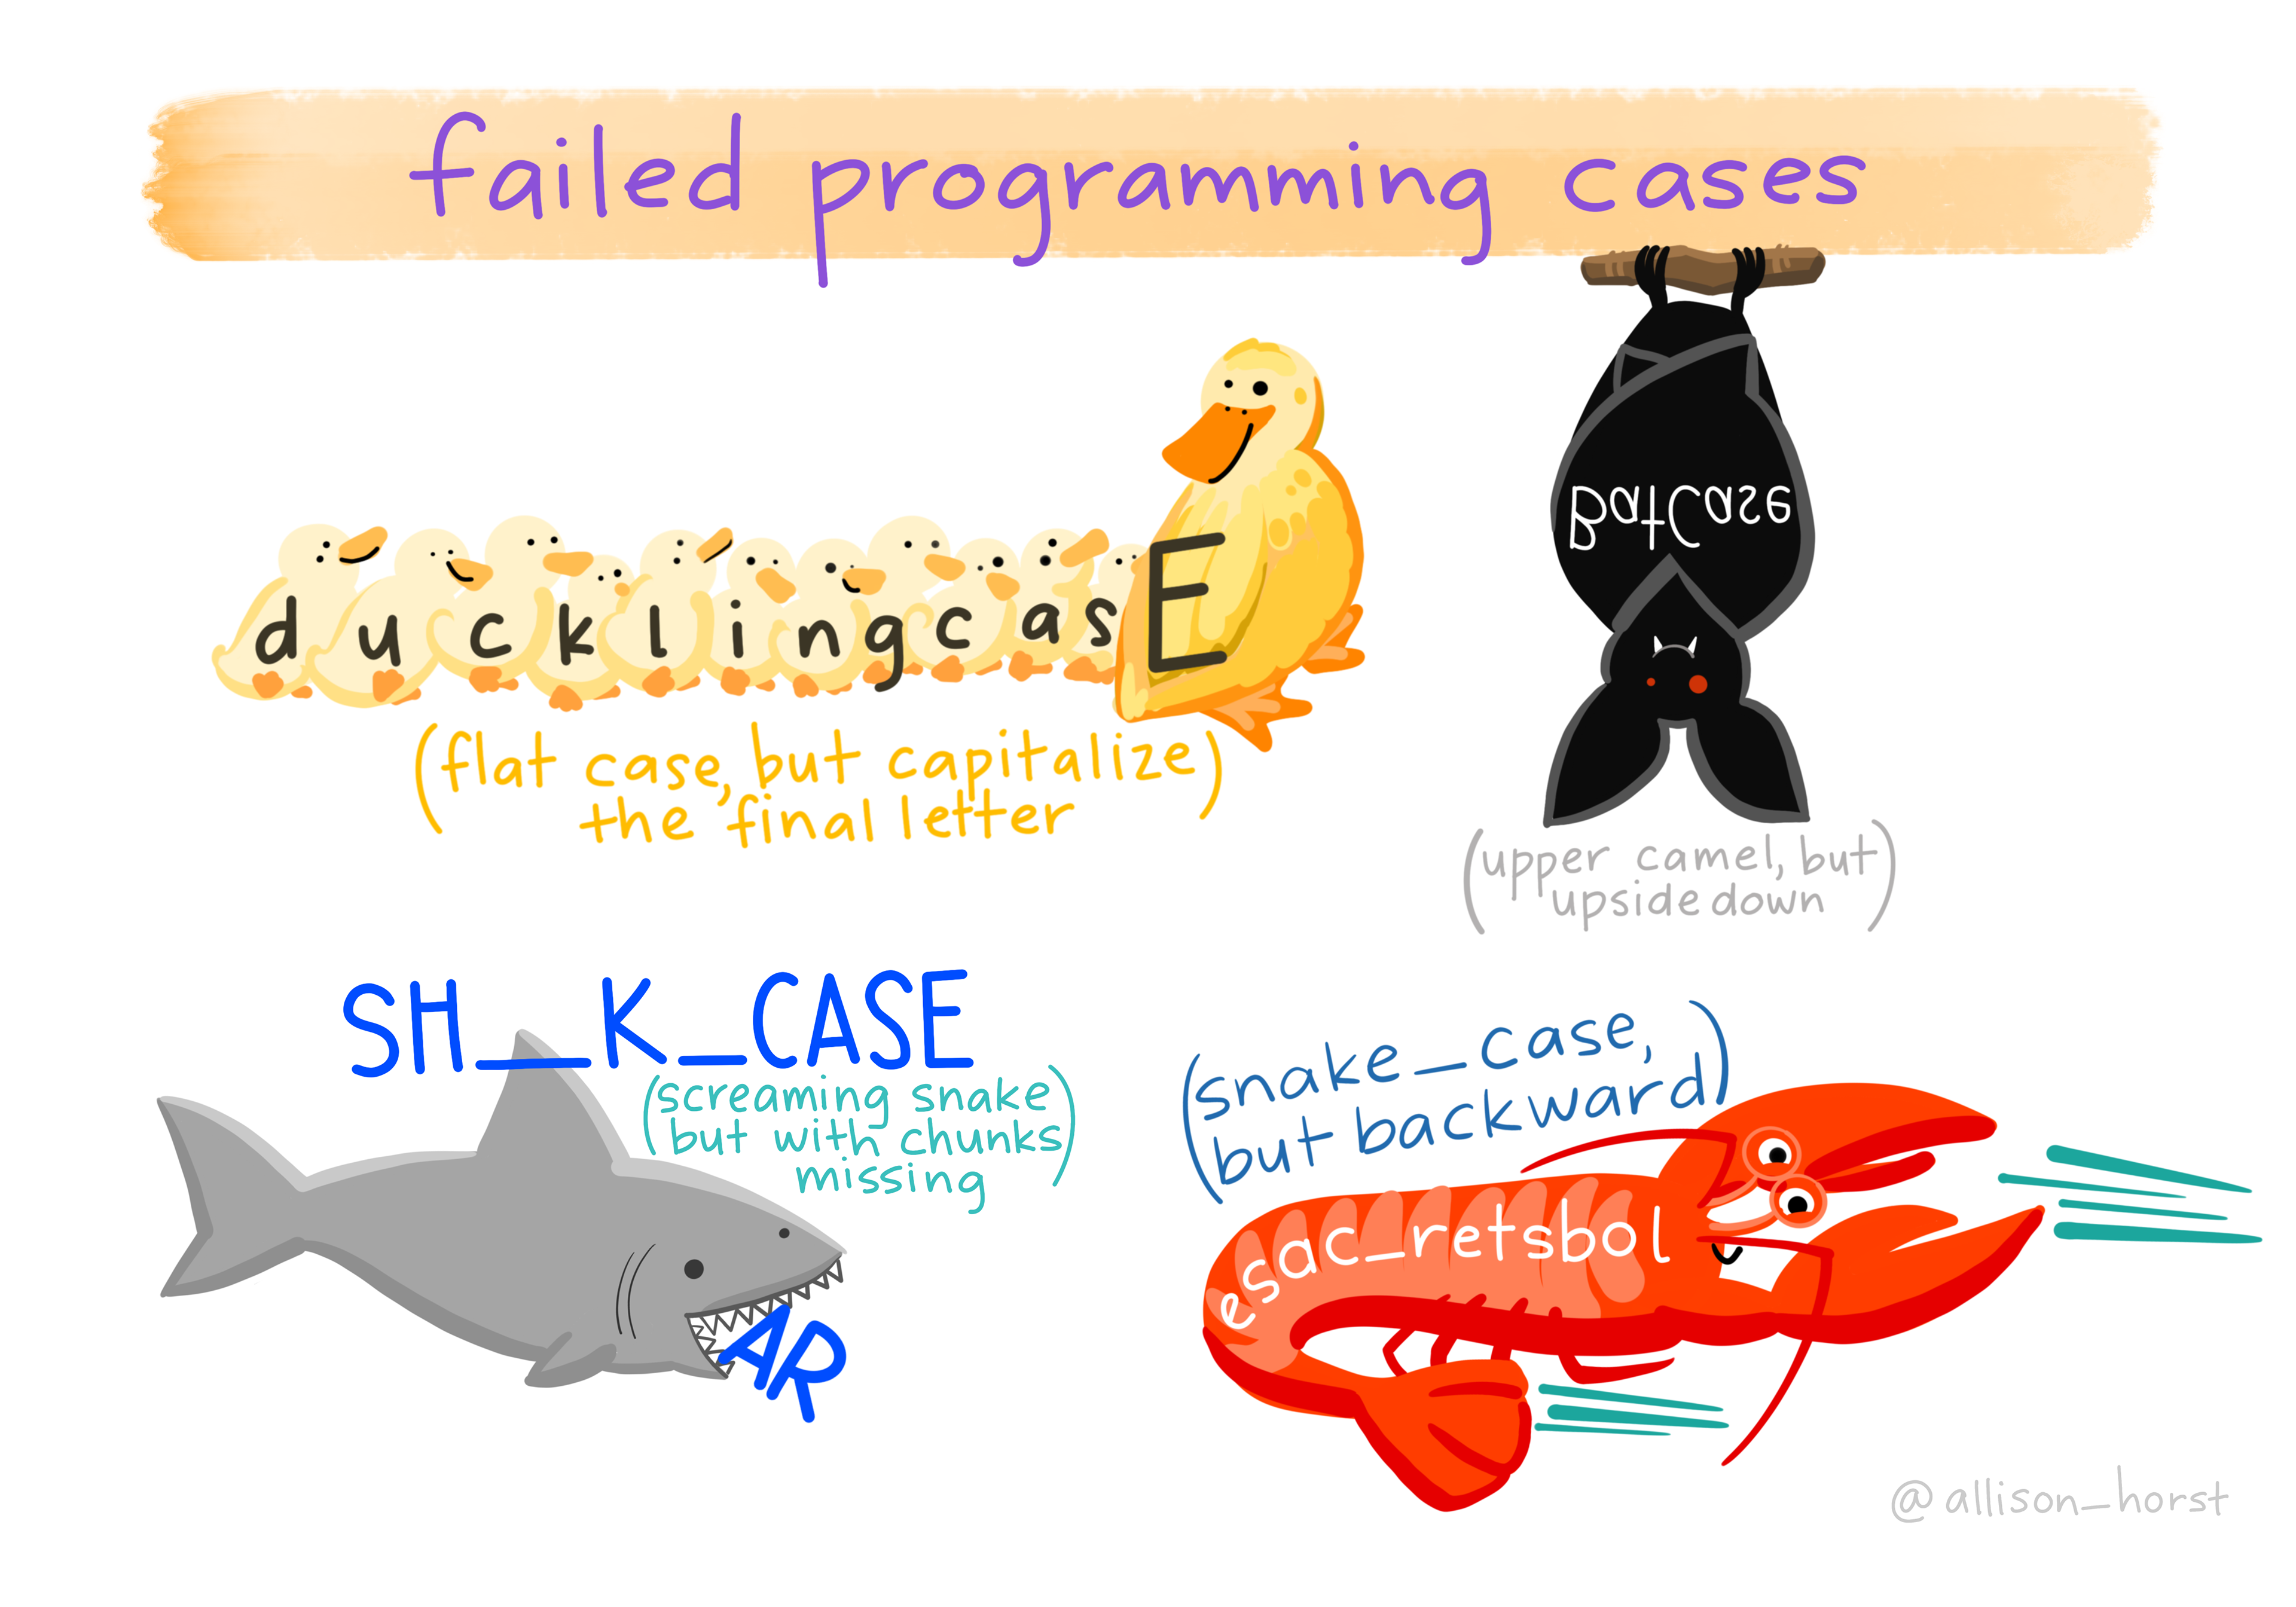
And a few you probably shouldn’t (or can’t)

The Brain Imaging Data Structure (BIDS)
A standard for storing and describing neuroimaging data

The anatomy of a BIDS filename
key1-value_key2-value_suffix.extension
- Entities are composed of key-value pairs
- Suffix provides some additional information (the data type: fMRI, anatomical, etc.)
- For example:
sub-control1,task-nbackare entitiesT1wandboldare suffixes.nii.gzand.tsvare extensions
Machine readable: query on large lists of files with code
> Sys.glob("~/AFQ_data/HBN/derivatives/afq/sub-*/ses-*/*model-DTI*.nii.gz")
[1] "/Users/arokem/AFQ_data/HBN/derivatives/afq/sub-NDARAA948VFH/ses-HBNsiteRU/sub-NDARAA948VFH_ses-HBNsiteRU_acq-64dir_space-T1w_desc-preproc_dwi_model-DTI_FA.nii.gz"
[2] "/Users/arokem/AFQ_data/HBN/derivatives/afq/sub-NDARAA948VFH/ses-HBNsiteRU/sub-NDARAA948VFH_ses-HBNsiteRU_acq-64dir_space-T1w_desc-preproc_dwi_model-DTI_diffmodel.nii.gz"
[3] "/Users/arokem/AFQ_data/HBN/derivatives/afq/sub-NDARAV554TP2/ses-HBNsiteRU/sub-NDARAV554TP2_ses-HBNsiteRU_acq-64dir_space-T1w_desc-preproc_dwi_model-DTI_FA.nii.gz"
[4] "/Users/arokem/AFQ_data/HBN/derivatives/afq/sub-NDARAV554TP2/ses-HBNsiteRU/sub-NDARAV554TP2_ses-HBNsiteRU_acq-64dir_space-T1w_desc-preproc_dwi_model-DTI_diffmodel.nii.gz"
Human readable
- Files that are related to each other are visually grouped
- Can use default file ordering in order to impose logical order
Consider putting numeric values first
Use ISO 8601 to order by date of creation
- An international standard for communicating about date/time
- For filenames, usually time is not relevant, but dates may be
- I recommend the
YYYYMMDDformat (but could also useYYYY-MM-DD) - In general, try to avoid reinventing the wheel

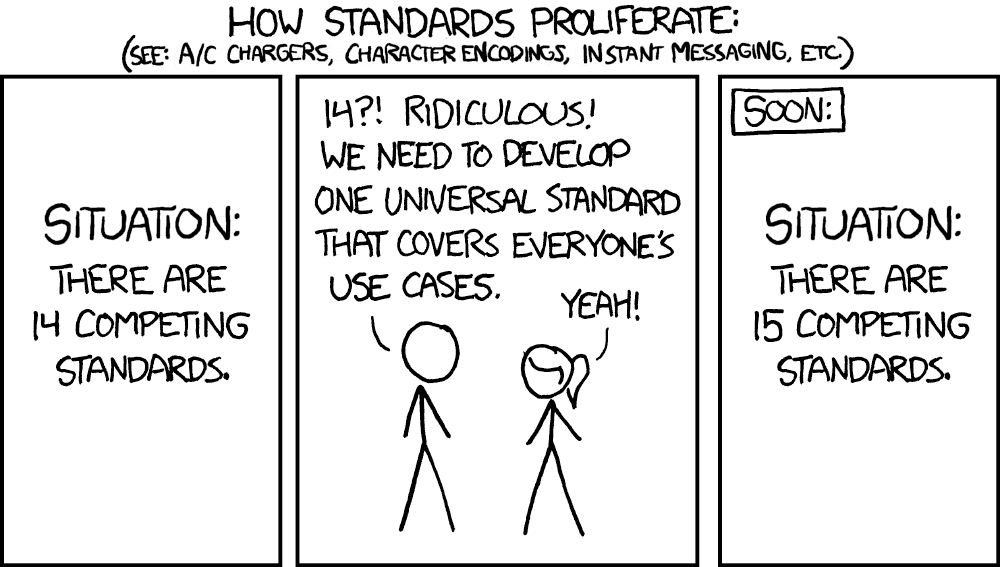
More about names and standards
- We saw BIDS before
- Different programming languages also have standards about naming variables
- For example, PEP8 for Python, tidyverse style guide for R.
Metadata
“Data about data”
- For every data table, create a “data dictionary”
- JavaScript Object Notation (JSON) provides a natural format for storing dictionaries
Metadata - example
{
    "age": {
        "Description": "age of the participant",
        "Units": "year"
    },
    "sex": {
        "Description": "sex of the participant as reported by the participant",
        "Levels": {
            "M": "male",
            "F": "female"
        }
    },
    "handedness": {
        "Description": "handedness of the participant as reported by the participant",
        "Levels": {
            "left": "left",
            "right": "right"
        }
    },
    "group": {
        "Description": "experimental group the participant belonged to",
        "Levels": {
            "read": "participants who read an inspirational text before the experiment",
            "write": "participants who wrote an inspirational text before the experiment"
        }
    }
}
Tidy data
- Each variable is a column; each column is a variable.
- Each observation is a row; each row is an observation.
- Each value is a cell; each cell is a single value.
| treatmenta | treatmentb | |
|---|---|---|
| John Smith | NA | 2 |
| Jane Doe | 16 | 11 |
| Mary Johnson | 3 | 1 |
| John Smith | Jane Doe | Mary Johnson | |
|---|---|---|---|
| treatmenta | NA | 16 | 3 |
| treatmentb | 2 | 11 | 1 |
| Person | Treatment | Result |
|---|---|---|
| John Smith | a | NA |
| Jane Doe | a | 16 |
| Mary Johnson | a | 3 |
| John Smith | b | 2 |
| Jane Doe | b | 11 |
| Mary Johnson | b | 1 |
Variable vs. observation
- It is easier to describe functional relationships between variables.
densityis the ratio ofweighttovolume.
- It is easier to make comparisons between rows.
- E.g., Treatment
avs. Treatmentb.
- E.g., Treatment
- There might also be multiple levels of observation
- We’ll see a hands-on example a little later.
“Dirty” data
- Comes in all kinds of forms.
- The article shows a few of these.
- This annotated version shows some more code (from
tidyr) to deal with some of these.
Data cleaning example: melting
Data cleaning example: melting
Data cleaning example: melting
Data cleaning example: melting
“Dirty” data
- The best way to avoid “dirty” data is to not create it.
- Use form validation.
- Design your data “schema” with tidy data in mind.
Benefits of tidy data
- Tidy tools: tools that take tidy data as input and produce tidy data as output.
- A grammar of data analysis:
dplyr - A grammar of visualization:
ggplot2 - Modeling:
lme4etc.
Workflows that are enabled by tidy data
- Split-apply-combine
- Merging between measurements
Split-apply-combine
Using dplyr
- Minimally:
group_by %>% summarize - But also:
filter %>% group_by %>% summarise - And even:
filter %>% group_by %>% summarise %>% aggregate - For some nice examples see this notebook
Merging across different data
Let’s look at this with a hands-on example